Manager Video Commentary
Share

Key Takeaways
- Equity markets rebounded in the second quarter of 2026 but remained extremely volatile as investors faced unpredictable geopolitical developments in the Middle East, renewed uncertainty over inflation and interest rates, and rising market concentration.
- The AI theme continues to be a major market driver, but ultimately the returns on capital spending relative to what is likely to be a multi-trillion-dollar investment cycle remain questionable for most companies.
- We continue to see attractive investment opportunities and believe we have a material advantage in this top-heavy market of being able to operate with flexibility as a true active manager and buy and sell shares opportunistically.
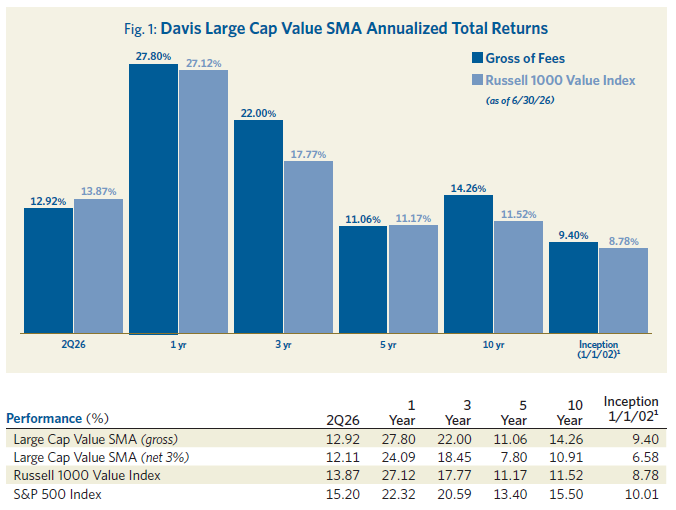
- The Davis Large Cap Value SMA portfolio returned +13.17% in the first half of 2026 versus +16.26% for the benchmark Russell 1000 Value Index, a result we achieved without being overweight in the parts of the market that we consider the most risky and overvalued (see Figure 1).
Net Average Annual Total returns as of June 30, 2026, for Davis Large Cap Value SMA Composite with a 3% maximum wrap fee: 1 year, 24.09%; 5 years, 18.45%; 10 years, 10.91%. The performance presented represents past performance and is not a guarantee of future results. Total return assumes reinvestment of dividends. Investment return and principal value will vary so that an investor may lose money. For current, quarterly returns, please ask your financial advisor to contact Davis Advisors. Current performance may be higher or lower. The investment strategies described herein are those of Davis Advisors. These materials are being provided for illustrative and informational purposes only. The information contained herein is obtained from multiple sources that are believed to be reliable. However, such information has not been verified, and may be different from the information included in documents and materials created by the sponsor firm in whose investment program a client participates. Some sponsor firms may require that these materials are preceded or accompanied by investment profiles or other documents or materials prepared by such sponsor firms, which will be provided upon a client’s request. For additional information, documents and/or materials, please speak to your Financial Advisor. Davis Advisors fee schedules are described in Part 2 of its Form ADV. The strategies herein may not be suitable or appropriate for all investors depending on their specific investment objectives and financial situation. Potential investors should consult with their financial professional before determining whether to invest in a strategy.
This material includes candid statements and observations regarding investment strategies, individual securities, and economic and market conditions; however, there is no guarantee that these statements, opinions or forecasts will prove to be correct. Equity markets are volatile and an investor may lose money. Past performance is not a guarantee of future results. Unless otherwise noted, all performance information is as of June 30, 2026. The investment strategies described herein are those of Davis Advisors. These materials are being provided for illustrative and informational purposes only. The information contained herein is obtained from multiple sources that are believed to be reliable. However, such information has not been verified, and may be different from the information included in documents and materials created by the sponsor firm in whose investment program a client participates. Some sponsor firms may require that these Davis Advisors materials are preceded or accompanied by investment profiles or other documents or materials prepared by such sponsor firms, which will be provided upon a client’s request. For additional information, documents and/or materials, please speak to your Financial Advisor.
Market Perspectives:
Looking Beyond the Indexes
The U.S. stock market rebounded in the second quarter of 2026 following earlier declines that coincided with the outbreak of hostilities with Iran. Geopolitics are inherently unpredictable and the market remains volatile. Some of this volatility is also due to renewed uncertainty over inflation, interest rates and U.S. monetary policy. Another key factor is the extreme concentration we continue to see. The S&P 500 Index’s price-to-earnings multiple is historically high, and the top 10 stocks in the index now account for over 40% of total market capitalization versus less than 19% a decade ago. More importantly, these are virtually all technology companies, most trading at lofty valuations based on very aggressive growth assumptions. It makes the index vulnerable to correction.
Some of the market froth has spilled into market segments long considered safe, like the so-called dividend darling stocks. These are trading at elevated multiples but typically have slow growth and the dividends they pay, as cash, earn investors less than the risk-free rate. Further, many of these companies represent traditional consumer brands which may look as if they will go on forever but face increasing threats from micro-branding enabled by social media and from the dynamic growth of private labels in the retail channel.
The juggernaut market leaders that dominate the indexes may look strong today competitively, but their valuations leave a lot to be desired on balance. This is especially so in scenarios where AI mania might be challenged by realities such as cost overruns, global supply chain limitations and fiercer competition. What we can say with confidence right now is that the AI theme has benefited from excitement and a spending boom. However, ultimately the returns on capital spending relative to what is shaping up to be a multi-trillion-dollar investment cycle remain questionable for most companies.
There is no question that AI is a vitally important investment theme. Davis has developed a framework for parsing AI-related opportunities using five categories: (1) the builders (e.g., chip manufacturers), (2) the enablers (e.g., semiconductor equipment manufacturers and other “pick and shovel” players in the industry, (3) the users (e.g., hyperscalers and other business models that can realistically apply AI to an existing business format in a way that enhances structural margins), (4) the insulated and protected (e.g., certain areas of food production and in-person leisure and entertainment), and (5) the so-called walking dead (i.e., companies facing existential risk from AI, possibly including some well-known SaaS names).
Currently it is the AI builders that are attracting most attention. We see evidence of Amara’s law1 at play here, which is the tendency to overestimate the short-term effects of a new technology while underestimating its long-term impacts. Some of the valuations in this category seem to assume a winner-takes-all scenario, but this is extremely unlikely. Any company’s ability to maintain high sales growth and high margins indefinitely is extremely low. At some point we expect valuations will adjust and the market will come down to earth.
Investors must look beyond the top-heavy market indexes to access the kinds of attractive investment opportunities we see today. In contrast to a market being driven by speculative fervor, we have positioned ourselves in much lower valuation situations, broadly speaking. The forward P/E on the Davis Large Cap Value SMA portfolio is about 13x versus 23x for the S&P 500 Index.2 At the same time, based on our analysis, we expect our portfolio of businesses to generate attractive earnings growth over the long term.
We believe that the benefits of diversification are currently under-appreciated by investors, many of whom seem focused almost exclusively on moonshot bullish calls. Our major sector exposures include industry-leading financial services companies, select technology companies, healthcare, energy and consumer staples. As a result, there are significant differences between our portfolio’s positioning and the unmanaged market indexes.
Beyond these differences, we think Davis Advisors has a material and under-appreciated advantage in this market—the ability to operate with flexibility as a true active manager and buy and sell shares opportunistically. We live and operate in a complex world and highly uncertain times. Given the plethora of moving parts in the world and in the markets, we expect bouts of volatility and idiosyncratic shifts in market drivers that are nearly impossible to predict in advance. In this environment investors would do well to proceed with caution, all the while staying committed to professionally vetted, durable, attractively priced companies that can be held for the long term.
Portfolio Review:
Between the Market Extremes
The Davis Large Cap Value SMA portfolio returned +13.17% in the first half of 2026 compared to a +16.26% return for the benchmark Russell 1000 Value Index and a +10.21% return for the S&P 500 Index (see Figure 1).
We achieved this positive result in a volatile market environment without having an overweight position in the parts of the market that we consider the riskiest, most overvalued and potentially the most prone to be in a bubble. This is one of the reasons we feel the portfolio is positioned well for the future.
A central tenet of our investment approach is that we do not look like the indexes. By being highly selective, we have constructed a portfolio of companies that combine strong earnings growth rates with attractive valuations relative to the benchmark (see Figure 2).
Selective, Attractive Growth, Undervalued2
| Portfolio | Russell 1000 Value Index | S&P 500 Index | |
|---|---|---|---|
| Holdings | 27 | 870 | 504 |
| EPS Growth (5 year) | 14.4% | 24.8% | 25.5% |
| P/E (Forward) | 13.1x | 18.9x | 22.5x |
The low valuation is key because it reduces risk. Our portfolio trades at a dramatic discount to the Russell 1000 Value Index (and even more so to the S&P 500 Index) despite having what we believe are attractive and realistically sustainable growth characteristics and benefiting from the durability of the underlying businesses. This combination of attractive growth at bargain prices underpins our conviction in the portfolio despite some concerns about hype and volatility in the market overall.
At the end of the second quarter, the portfolio’s largest sector weightings (by market capitalization) were financials (25.5%), healthcare (21.2%) and technology-related stocks (18.7%), a category that combines two GICS sectors, information technology and communication services.
In financials, we hold a carefully selected group of retail banking giants and specialty insurers, and a diversified financial conglomerate, Berkshire Hathaway. Our financial holdings have in common that they consist of, or control, companies with high-efficiency business economics that we expect will become even better as AI permeates through their organizations. We believe selectivity and differentiation will pay off as we continue to see a divergence between those companies that are positioned for the changes ahead in an AI-centric world and companies that we believe will inevitably be disadvantaged.
Healthcare, the second-largest allocation in the portfolio, was as a group the largest positive contributor to relative performance in the second quarter. In this category we own select managed care, pharmaceutical and laboratory testing companies, among them UnitedHealthcare. Despite the recent run-up in their stock prices we believe that our healthcare businesses remain undervalued versus our expectations for their normalized earnings power and margins. The national healthcare pie continues to grow in the U.S. economy, and we have selected on a bottom-up basis those companies we feel are best-positioned to benefit both from population demographic tailwinds and from future AI-driven efficiencies.
Among technology-related stocks, we are significantly underweight in the information technology sector (and the Magnificent 7 as a group) relative to our benchmark. During the second quarter we actively pared certain of our semiconductor holdings, mainly on valuation. We continue to like these companies but must stick to our discipline to ensure reasonable margins of safety. At the same time, we are significantly overweight in communication services, which was a major contributor to performance in the second quarter. Our holdings here are focused on key consumer-facing technology-related companies with massive established user networks, proven management expertise and an AI-forward approach.
While AI is by necessity an important theme in our portfolio positioning, we also like a category of consumer-facing companies that are somewhat insulated from AI effects and the related volatility. These are businesses that have durability in the sense that they are not likely to be disrupted and can withstand cyclical downturns. At the same time, they are attractively valued, which in some cases may be due to earnings being depressed for specific short-term reasons not related to the underlying durability of their businesses. A representative holding in this category is Tyson Foods, one of the world’s largest food companies that processes and markets meat, poultry and prepared food products under a stable of well-known consumer brand names. Another holding is MGM Resorts International which is the biggest operator on the Las Vegas strip and additionally owns interests in China and in Japan, where it is building the country’s first casino resort in a newly legalized gaming market.
During the second quarter our energy position in Coterra became Devon Energy through a merger of equals. The newly combined entity of Devon Energy is an independent exploration and production company in oil and natural gas focused on unconventional shale assets, primarily in the Permian Basin and the Marcellus Shale.
A key characteristic of the current volatile market environment is the bipolar nature of investor sentiment. On one hand are people who believe we have reached a new plateau of prosperity, and that nothing could be better than what we see today. These people are price-insensitive investors and prone to chasing momentum and taking risks. On the other hand there are the pessimists for whom the world is always ending. These investors are holding mainly cash—and of course are also taking a risk, that of not being invested for the long term.
Davis Advisors sits between these two extremes, opportunistically. We try to build a portfolio based not on excessive optimism or pessimism, but on the reality that our investments must be able to withstand the inevitable shocks in addition to offering the potential to make progress when times are good.
Our high selectivity allows us to identify that handful of companies that can be combined into a portfolio that offers truly attractive earnings growth and durability alongside discounted valuations. In our view, it is key to organizing an effective investment strategy in today’s uncertain world. This is why, despite concern and caution about the volatile market environment, we continue to have confidence in how we are positioned for 2026 and beyond.
Together on This Journey
For more than 50 years, Davis Advisors has navigated a constantly changing investment landscape guided by one North Star: to grow the value of the funds entrusted to us. We are pleased to have achieved strong results thus far and look forward to the decades ahead. With more than $2 billion of our own money invested in our portfolios, we stand shoulder to shoulder with our clients on this long journey.4 We are grateful for your trust and are well-positioned for the future.
Amara’s law states that we tend to overestimate the effect of a technology in the short run and underestimate its effect in the long run. It was coined in 1978 by Roy Amara, a noted American researcher, scientist and futurist.
Five-year EPS Growth Rate (5-year EPS) is the average annualized earnings per share growth for a company over the past 5 years. The values shown are the weighted average of the 5-year EPS of the stocks in the Portfolio or Index. Approximately 2.20% of the assets of the Portfolio are not accounted for in the calculation of 5-year EPS as relevant information on certain companies is not available to the Advisors’ data provider. The trailing five-year EPS growth figures shown here are historical and include for the Davis Large Cap Value SMA portfolio numerous companies, particularly in healthcare services and consumer staples, that were acquired during the trailing period precisely because we believe these businesses are likely capable of much stronger EPS growth on a prospective, go-forward basis. Meanwhile, we believe the unusually high growth rates shown for the Russell 1000 Value Index and S&P 500 Index are likely unsustainable based on historical experience and our own forward-looking analysis.
Forward Price/Earnings (Forward P/E) Ratio is a stock’s price at the date indicated divided by the company’s forecasted earnings for the following 12 months based on estimates provided by the Portfolio’s data provider. These values for both the Portfolio and the Index are the weighted average of the stocks in the portfolio or Index.
As of 6/30/26, Davis Advisors, the Davis family and Foundation, and our employees have more than $2 billion invested alongside clients in similarly managed accounts and strategies.
This material may be shared with existing and potential clients to provide information concerning market conditions and the investment strategies and techniques used by Davis Advisors to manage its client accounts. Please refer to Davis Advisors Form ADV Part 2 for more information regarding investment strategies, risks, fees, and expenses. Clients should also review other relevant material, including a schedule of investments listing securities held in their account.
*As of 6/30/26. Includes Davis Advisors, Davis family and Foundation, and our employees. †The Attractive Growth and Undervalued reference in this piece relates to underlying characteristics of the portfolio holdings. There is no guarantee that the Portfolio’s performance will be positive as equity markets are volatile and an investor may lose money. Past performance is not a guarantee of future returns. Five-year EPS Growth Rate (5-year EPS) is the average annualized earnings per share growth for a company over the past years. The values shown are the weighted average of the 5-year EPS of the stocks in the Portfolio or Index. The 5-year EPS of the S&P 500 is 25.5%. Approximately 2.20% of the assets of the Portfolio are not accounted for in the calculation of 5-year EPS as relevant information on certain companies is not available to the Portfolio’s data provider. Forward Price/Earnings (Forward P/E) Ratio is a stock’s price at the date indicated divided by the company’s forecasted earnings for the following 12 months based on estimates provided by the Advisor’s data provider. These values for both the portfolio and the Index are the weighted average of the stocks in the Portfolio or Index. The Forward P/E of the S&P 500 is 22.5x. ‡For information purposes only. Not a recommendation to buy or sell any security. **Sources: Davis Advisors and Clearwater Wilshire Atlas.
The investment strategies described herein are those of Davis Advisors. These materials are being provided for illustrative and informational purposes only. The information contained herein is obtained from multiple sources that are believed to be reliable. However, such information has not been verified, and may be different from the information included in documents and materials created by the sponsor firm in whose investment program a client participates. Some sponsor firms may require that these materials are preceded or accompanied by investment profiles or other documents or materials prepared by such sponsor firms, which will be provided upon a client’s request. For additional information, documents and/or materials, please speak to your Financial Advisor.
The performance of mutual funds is included in the Composite. The performance of the mutual funds and other Davis managed accounts may be materially different. For example, the Davis New York Venture Fund may be significantly larger than another Davis managed account and may be managed with a view toward different client needs and considerations. The differences that may affect investment performance include, but are not limited to: the timing of cash deposits and withdrawals, the possibility that Davis Advisors may not buy or sell a given security on behalf of all clients pursuing similar strategies, the price and timing differences when buying or selling securities, the size of the account, the differences in expenses and other fees, and the clients pursuing similar investment strategies but imposing different investment restrictions. This is not a solicitation to invest in the Davis New York Venture Fund or any other fund.
Davis Advisors is committed to communicating with our investment partners as candidly as possible because we believe our clients benefit from understanding our investment philosophy and approach. Our views and opinions include “forward-looking statements” which may or may not be accurate over the long term. Forward-looking statements can be identified by words like “believe,” “expect,” “anticipate,” or similar expressions. You should not place undue reliance on forward-looking statements, which are current as of the date of this material. We disclaim any obligation to update or alter any forward-looking statements, whether as a result of new information, future events, or otherwise. While we believe we have a reasonable basis for our appraisals and we have confidence in our opinions, actual results may differ materially from those we anticipate.
Returns from inception (4/1/69) through 6/31/01, were calculated from the Davis Large Cap Value Composite (see description below). Returns from 1/1/02, through the date of this material were calculated from the Large Cap Value (SMA) Composite.
Davis Advisors’ Large Cap Value Composite includes all actual, fee-paying, discretionary Large Cap Value investing style institutional accounts, mutual funds, and wrap accounts under management including those accounts no longer managed. Effective 1/1/98, a minimum account size of $3,500,000 was established. Accounts below this minimum are deemed not to be representative of the Composite’s intended strategy and as such are not included in the Composite. A time-weighted internal rate of return formula is used to calculate performance for the accounts included in the Composite.
Davis Advisors’ Large Cap Value (SMA) Composite excludes institutional accounts and mutual funds. Performance shown from 1/1/02, through 12/31/10, includes all eligible wrap accounts with a minimum account size of $3,500,000 from inception date for the first full month of account management and includes closed accounts through the last day of the month prior to the account’s closing. For the performance shown from 1/1/11, through the date of this material, the Davis Advisors’ Large Cap Value SMA Composite includes all eligible wrap accounts with no account minimum from inception date for the first full month of account management and includes closed accounts through the last day of the month prior to the account’s closing. The net of fees rate of return formula used by the wrap-fee style accounts is calculated based on a hypothetical 3% maximum wrap fee charged by the wrap account sponsor for all account service, including advisory fees for the period 1/1/06, and thereafter. For the gross performance results, custodian fees and advisory fees are treated as cash withdrawals. A list of Davis Advisors’ Composites is available upon request.
This material discusses companies in conformance with Rule 206(4)-1 of the Investment Advisers Act of 1940 and guidance published thereunder. Six companies are discussed and are chosen as follows: (1–4) current holdings based on December 31 holdings; (5) the first new position; and (6) the first position that is completely closed out. Starting at the beginning of the year, the holdings from a Large-Cap Value model portfolio are listed in descending order based on percentage owned. Companies that reflect different weights are then selected. For the first quarter, holdings numbered 1, 6, 11, and 16 are selected and discussed. For the second quarter, holdings numbered 2, 7, 12, and 17 are selected and discussed. This pattern then repeats itself for the following quarters. If a holding is no longer in the portfolio then the next holding listed is discussed. No more than two of these holdings can come from the same sector per piece. None of these holdings can be discussed if they were discussed in the previous three quarters. If there were no purchases or sales, the purchases and sales are omitted from the material. If there were multiple purchases and/or sales, the purchase and sale discussed shall be the earliest to occur. As this is primarily a domestic equity strategy, no more than one foreign holding will be discussed in any material. If more than one foreign holding would be discussed based on the criteria above, the holding with the largest percent of assets in the model portfolio would be chosen. However, if the model portfolio has an aggregate foreign holding percentage that is greater than 15% the commentary would include a discussion of the largest foreign holding in the model portfolio that has not been discussed in the previous three quarters. Other than the recent buy and sell, any company discussed must constitute at least 1% of the portfolio as of December 31.
The information provided in this material does not provide information reasonably sufficient upon which to base an investment decision and should not be considered a recommendation to buy or sell any particular security. There is no assurance that any of the securities discussed herein will remain in an account at the time this material is received or that securities sold have not been repurchased. The securities discussed do not represent an account’s entire portfolio and in the aggregate may represent only a small percentage of any account’s portfolio holdings. It should not be assumed that any of the securities discussed were or will prove to be profitable, or that the investment recommendations or decisions we make in the future will be profitable or will equal the investment performance of the securities discussed herein. It is possible that a security was profitable over the previous five year period of time but was not profitable over the last year. In order to determine if a certain security added value to a specific portfolio, it is important to take into consideration at what time that security was added to that specific portfolio. A complete listing of all securities purchased or sold in an account, including the date and execution prices, is available upon request.
The investment objective of a Davis Large Cap Value account is long-term growth of capital. There can be no assurance that Davis will achieve its objective. Davis Advisors uses the Davis Investment Discipline to invest a client’s assets principally in common stocks (including indirect holdings of common stock through depositary receipts) issued by large companies with market capitalizations of at least $10 billion. Historically, the Large-Cap Value strategy has invested a significant portion of its assets in financial services companies and in foreign companies, and may also invest in mid- and small-capitalization companies. The principal risks are: China risk, common stock risk, depositary receipts risk, emerging market risk, fees and expenses risk, financial services risk, focused portfolio risk, foreign country risk, foreign currency risk, headline risk, large-capitalization companies risk, manager risk, mid- and small-capitalization companies risk, and stock market risk. See the ADV Part 2 for a description of these principal risks.
The attractive growth reference in this material relates to underlying characteristics of the portfolio holdings. There is no guarantee that the portfolio performance will be positive as equity markets are volatile and an investor may lose money.
We gather our index data from a combination of reputable sources, including, but not limited to, Clearwater Wilshire Atlas, Lipper, and index websites.
The S&P 500 Index is an unmanaged index that covers 500 leading companies and captures approximately 80% coverage of available market capitalization. The Russell 1000 Value Index measures the performance of the large-cap value segment of the U.S. equity universe. It includes those Russell 1000 companies with lower price-to-book ratios and lower expected growth values. The Russell 1000 Value Index is constructed to provide a comprehensive and unbiased barometer for the large-cap value segment. Investments cannot be made directly in an index.
Item #3894 6/26 Davis Advisors, 2949 East Elvira Road, Suite 101, Tucson, AZ 85756 800-717-3477, davisadvisors.com
Large Cap Value SMA Portfolio
Summer Update 2026